Traffic Log
How to read the log
The Traffic Log lets you inspect your app's HTTP/HTTPS traffic in real time.
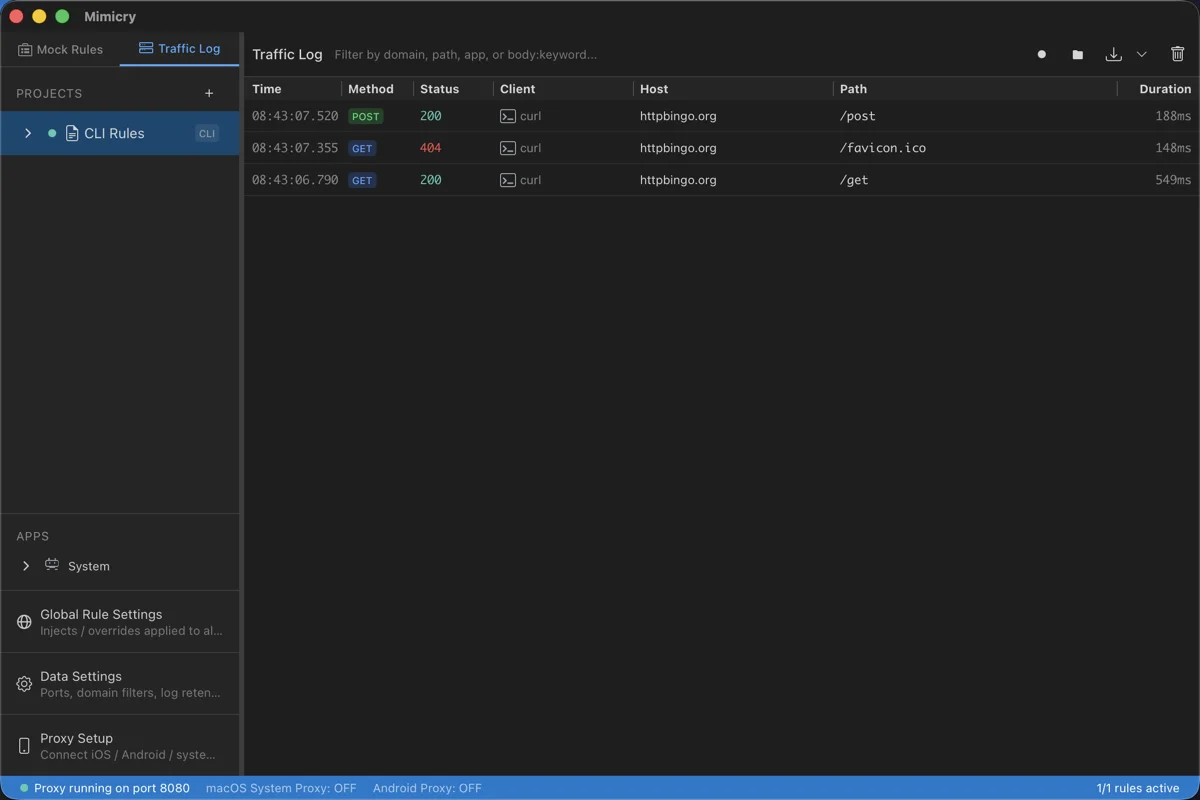
| Column | Description |
|---|---|
| Time | Request timestamp |
| Method | HTTP method (GET, POST, PUT, DELETE, etc.) |
| Status | Response status code (200, 404, 500, etc.). States such as "a mock was applied" show up as a small dot in this cell |
| Client | The app the request came from (icon and name) |
| Host | The host the request was sent to |
| Path | Request path (GraphQL requests also show the operation name) |
| Duration | Time until the response came back, in milliseconds |
Tip: A request that matched a mock rule (or whose response was rewritten) gets a purple dot in the Status column, and the whole row is tinted purple. A rewritten request gets a blue dot instead. Regular requests have no special marker.
Request / response details
Click a log entry to open the detail panel.
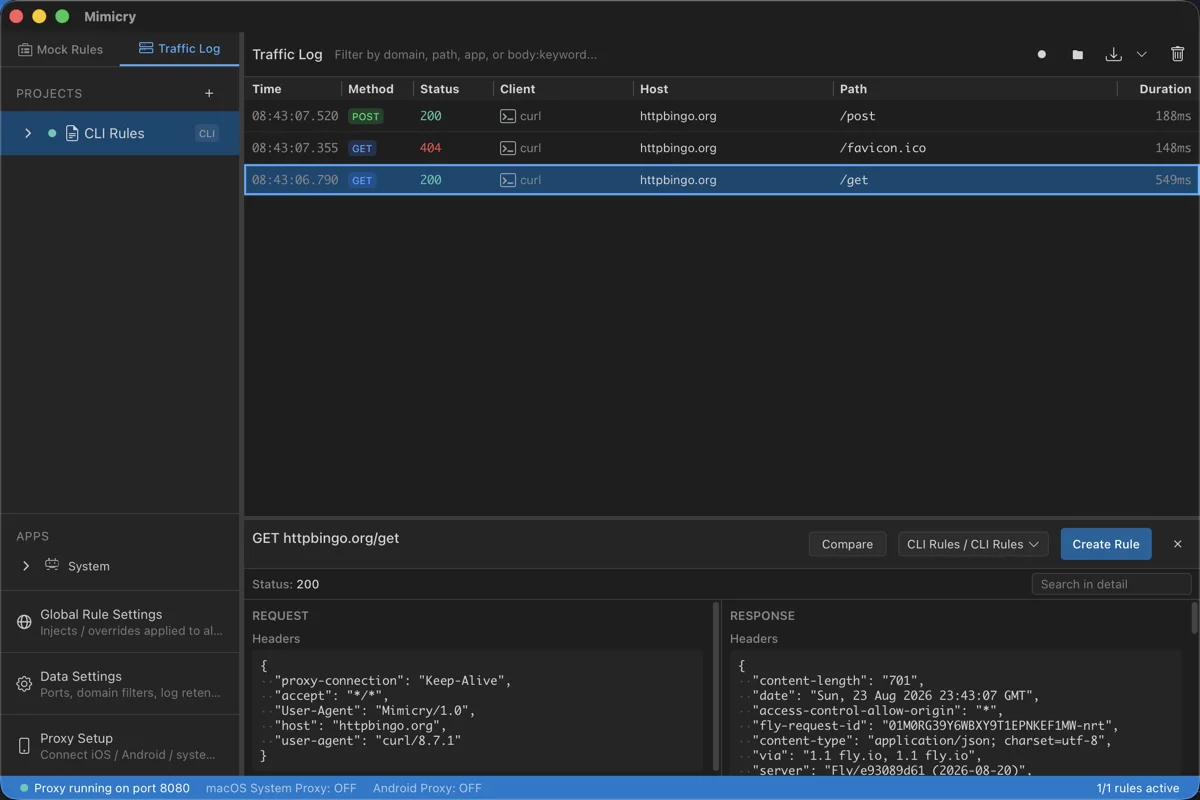
Request
- URL (including query parameters)
- Headers
- Body (for POST/PUT)
Response
- Status code
- Headers
- Body (JSON/text/HTML)
Filtering
Search filter
Type a string in the search box to show only requests whose URL contains it.
api/usersIgnored domains
You can ignore requests from specific domains. Configure this from App Settings in the sidebar.
# Example ignored domains
analytics.google.com
crashlytics.google.com
firebaseinstallations.googleapis.com
You can also add a domain by right-clicking an entry in the traffic log and selecting "Add this host to ignored domains".
Clearing the log
Use the clear button at the top of the log list to delete all currently displayed logs.
How many logs are kept
The app keeps at most the newest 1000 traffic log entries and discards the oldest first once it goes over. You can lower the number with "Max log entries" in App Settings (the default is 500). A Time Travel recording is built from this log when you stop it, so the same limit applies to it.
Create a rule from a log
You can create a mock rule directly from captured traffic.
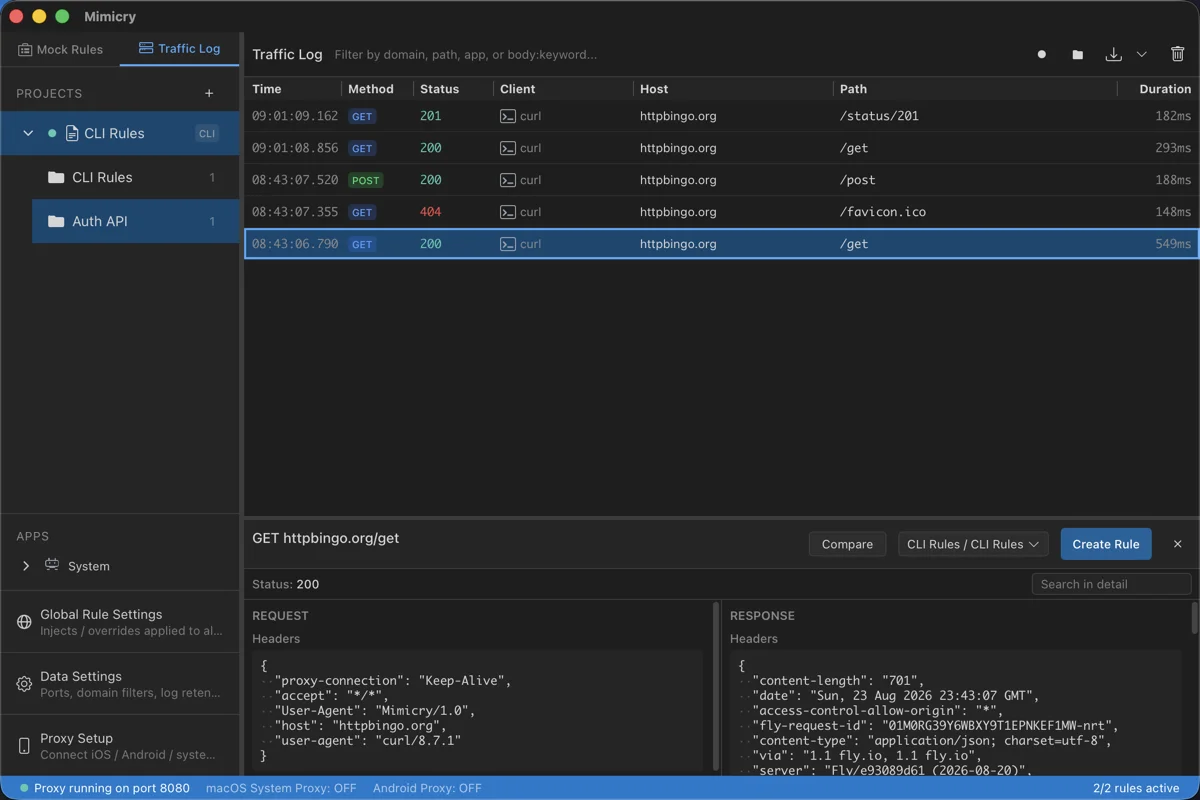
In the Traffic Log, click the request you want to mock.
Click the Create Rule button in the detail panel.
The URL pattern, method, response headers, and response body are filled in automatically.
Edit the settings as needed, choose a destination folder, and save.
Tip: Editing the URL pattern to add a wildcard makes it match similar requests too.
Example: /api/users/123 → /api/users/*
Export / import
Saving the traffic log (HAR export)
You can save the traffic log to a file in .har (HTTP Archive) format. HAR is a W3C standard format and can also be opened in tools such as Chrome DevTools and Proxyman.
- Click the export button at the top right of the traffic log panel
- Save it as a .har file
You can view a saved .har file by dragging and dropping it onto the Mimicry app or double-clicking it.
Export formats
The menu next to the export button lets you choose between HAR (.har) and Mimicry (.mimicry). Those are the two formats the traffic log panel writes. Video (.mp4) is exported from the viewer that opens a recording with screen capture. Images and other media over the per-entry or total size limit are left out of the file, and a toast tells you how many.
Exporting mock rules
From App Settings in the sidebar, you can export mock rules in JSON format.
- Sharing with team members
- Saving as a backup
- Migrating settings between different Macs
Importing settings
You can import a JSON file exported from App Settings.
Note: An import is a merge — nothing existing is ever deleted. Projects and folders are upserted by ID, so one with the same ID is updated in place. Only a project/folder that has the same name but a different ID is renamed automatically, which means re-importing the same file doesn't create duplicates.